UK businesses must prioritise high conversion websites—turning casual browsers into loyal customers. With online competition fiercer than ever, understanding what makes visitors click, scroll, or exit is critical. Enter heatmaps and A/B testing: two powerful tools that transform guesswork into actionable insights.
Combining these strategies, can help you create high conversion websites that resonate with your audience and drive tangible results. Let’s explore how—and why—these tactics are non-negotiable for UK brands aiming to stand out.
Why Heatmaps Are Your Secret Weapon?
Imagine a thermal image of your webpage, with “hot” zones showing where users linger and “cold” spots highlighting neglected areas. Heatmaps visually map user interactions—clicks, scrolls, and cursor movements—offering a goldmine of behavioural data. For UK businesses, this means discovering whether your “Buy Now” button catches the eye or if your hero image is scrolling past unnoticed.
Heatmaps are particularly valuable for identifying cultural nuances. For instance, UK users often prefer concise, direct messaging over overly salesy language. If your heatmap reveals that visitors are skipping flashy banners but engaging with straightforward value propositions, it’s a clear sign to adapt your approach.
Types of Heatmaps (and How They Help)
- Click Heatmaps: Reveal where users click most—ideal for testing button placements or spotting accidental taps on non-links (a common frustration on mobile!).
- Scroll Heatmaps: Show how far visitors scroll. If 80% drop off before your pricing section, it’s time to rethink content hierarchy.
- Cursor Movement Maps: While not exact, cursor trails often mirror eye movement, hinting at which sections captivate users.
Real-World Insight: A Manchester-based e-commerce brand used scroll maps to find that users missed their free shipping banner tucked below the fold. Relocating it boosted conversions by 22%.
A/B Testing: The Science Behind Smarter Decisions
What Is A/B Testing and How Does It Help Achieve High Conversion Websites?
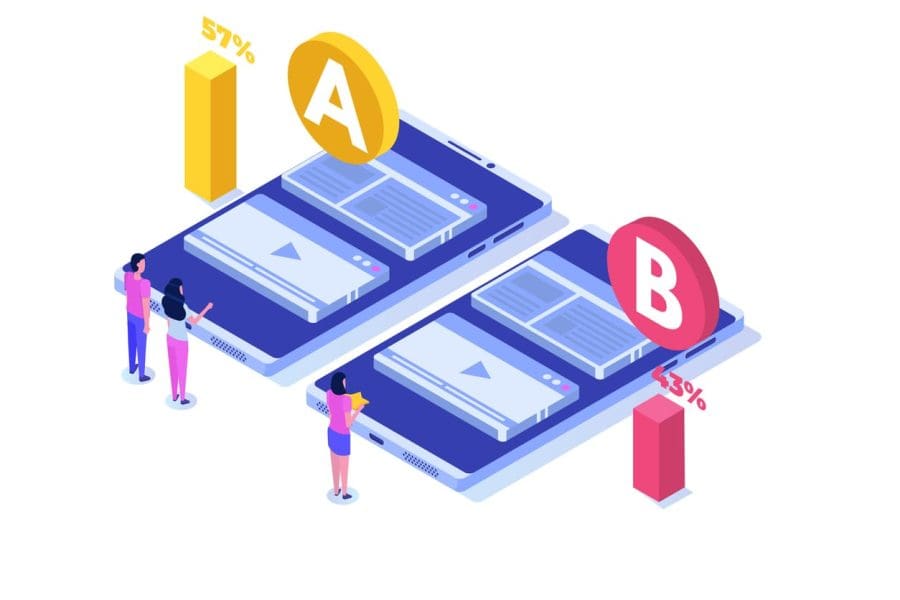
A/B testing involves comparing two webpage versions (A and B) to see which performs better. Think of it as a digital “taste test”: Does a green “Subscribe” button outperform a red one? Does a cheeky headline resonate more than a formal one? For UK audiences, subtle cultural nuances—like humour or local phrasing—can make all the difference.
Why A/B Testing Matters
- Data Over Hunches: Ditch assumptions. If Londoners prefer concise CTAs while Scots engage with detailed copy, testing reveals these patterns.
- Boost Conversions: Even minor tweaks, like changing “Get Started” to “Claim Your Free Trial,” can lift sign-ups.
- Refine User Journeys: Smooth out friction points—like a lengthy checkout form—to keep visitors engaged.
Marrying Heatmaps and A/B Testing for Maximum Impact
Heatmaps highlight where issues exist; A/B testing reveals how to fix them. Together, they’re a dynamic duo for crafting high conversion websites.
Step-by-Step Integration
- Gather Heatmap Intel: Use tools like Hotjar or Crazy Egg to spot trends (e.g., users ignoring your FAQ section).
- Identify Test Opportunities: If click maps show low engagement on your main CTA, test variations (size, colour, text).
- Run Targeted A/B Tests: Try two headlines, layouts, or images. Pro tip: Test one element at a time for clarity.
- Analyse & Iterate: Did Version B’s orange button outshine Version A’s blue? Implement the winner, then repeat.
Example: A Leeds-based travel agency noticed via heatmaps that users were abandoning their booking form at the “Payment” stage. A/B testing revealed that adding trust signals like SSL badges and a money-back guarantee reduced drop-offs by 18%.
Best Practices for UK-Focused High Conversion Websites
1. CTAs That Command Attention
UK users appreciate clarity with a touch of personality. Instead of generic “Submit,” try “Send My Quote” or “Download Your Guide.” Use heatmaps to ensure CTAs aren’t buried—prime spots include above the fold or anchored at the sidebar.
Local Insight: Phrases like “Get Started” may underperform compared to “Try It Free” or “Join 10,000 UK Users.” Test regionally tailored messaging.
2. Prioritise Readability
Brits value concise, well-structured content. Break up text with subheadings, bullet points, and visuals. If scroll maps show users abandoning halfway, condense copy or add engaging elements like testimonials.
Tip: Use British spellings and colloquialisms (e.g., “colour” vs. “color,” “cheers” vs. “thanks”) to build rapport.
3. Streamline Navigation
A cluttered menu is a conversion killer. Use click maps to identify rarely used links. For instance, if “Blog” gets minimal clicks, consider merging it into a resource hub.
4. Mobile-First Design
With 76% of UK adults shopping via smartphone, ensure mobile layouts are thumb-friendly. Test button sizes and forms on devices to reduce bounce rates.
Stat Alert: Pages that load in under 2 seconds have a 9% higher conversion rate. Optimise images and leverage caching for speed.
5. Build Trust with Local Credibility
Display UK-centric trust badges (e.g., “Recommended by Trustpilot UK” or “Accepted by 200+ British Clinics”). Testimonials from UK clients or partnerships with local brands also enhance credibility.
Measuring Success: KPIs Every UK Business Should Track
- Conversion Rate: The star metric. Aim for incremental gains—even a 2% lift can mean thousands in revenue.
- Bounce Rate: High rates? Your landing page might be mismatched with ad promises or slow to load.
- Average Session Duration: Longer visits often signal engagement. Pair this with scroll maps to see if users are truly absorbing content.
- Geographic Performance: Compare conversion rates across UK regions. A campaign resonating in London might flop in Glasgow without localised tweaks.
Overcoming Common UK-Specific Challenges
- GDPR Compliance: Ensure heatmap and A/B testing tools comply with UK data laws. Tools like Microsoft Clarity offer GDPR-friendly analytics.
- Cultural Sensitivity: Avoid stereotypes (e.g., excessive royal references) unless they align with your brand. A/B test humour to avoid misfires.
- Seasonal Trends: Tailor tests around UK events (Black Friday, Boxing Day). A heatmap in December might show users hunting for discount codes.
The Road to Continuous Improvement
The digital landscape never sleeps. Algorithms change, trends shift, and user preferences evolve. Regular heatmap analysis and A/B testing keep your site agile. Schedule quarterly audits to stay ahead—seasonal shifts (like Christmas shopping surges) offer perfect testing opportunities.
Pro Tip: Create a “test backlog” of ideas inspired by heatmap anomalies. For example, if users hover over your “About Us” page but don’t click, test adding team photos or client logos to build trust.
Final Thoughts: Turning Insights into Action
Building high conversion websites isn’t about flashy gimmicks; it’s about listening to your audience. Heatmaps and A/B testing provide the insights needed to craft experiences that resonate with UK users—whether they’re in Edinburgh, Cardiff, or London.
Optimisation is a journey, not a one-time fix. Start small: run a weekly A/B test or analyse one heatmap report monthly. Over time, these incremental changes compound into transformative results.
Ready to transform your site into a conversion powerhouse? Book a call with our experts here at We Get Digital and see how we can elevate your online presence. We specialise in helping UK businesses unlock growth through data-driven website planning and optimisation.
